[C-Level Report] Season Promotion Discount Strategy That Doesn't Fail
Combining ERP data with AI agents to analyze years of promotions and discover discount structures that consistently work by product and store.
Chuseok promotions, Black Friday, Lunar New Year sales...
Companies face recurring seasonal events and deliberate over discount rates, durations, product scope, and store coverage. On what basis are we determining discount ranges and durations by product and store?
Promotions can drive sales, but they can also burden margins, pull forward demand without incremental lift, or cannibalize sales of other products. Even small differences in duration and scope can dramatically change the performance structure.
When ERP base table data, minimal marketing knowledge, and AI comparison tools are combined, we can analyze years of promotions at once to identify which discount structures consistently worked by product and store. This newsletter explores how simple data analysis and AI agent configuration can uncover new growth opportunities, through AI-automated report case studies.
1. First Define 'Efficiency Data Metrics'
Promotion analysis fails not because of insufficient data, but because it starts without clearly defined evaluation metrics for judging performance and efficiency.
We decompose promotions along two axes. These metrics are designed not as simple result summaries, but to evaluate discount outcomes, structural impact, and efficiency and timing appropriateness together.
① Revenue Perspective
- Promotion Sales: Total revenue showing the 'scale' of the promotion
- Incremental Lift: Actual additional revenue generated versus baseline
- Cross Lift: Cross-selling effect or cannibalization in non-discounted product groups
- Discount Sensitivity: Revenue increment response per 1%p discount rate
- Duration Sensitivity: Evaluating duration design appropriateness through when sales concentrate during the period
② Inventory Perspective
- Promotion Depletion: Depletion rate change before and after promotion
- Incremental Depletion Lift: Degree of inventory turnover acceleration during promotion
- Cross Depletion Lift: Inventory turnover acceleration of non-discounted products during promotion
- Depletion Discount Sensitivity: Depletion efficiency relative to discount intensity
- Depletion Duration Sensitivity: Whether depletion concentrates in early, mid, or late period
The key differentiator here is that when AI writes the report, it doesn't judge based solely on this promotion's data. For deeper analysis and contextual understanding, the Agent receives background data from years of promotions.
We're not explaining "how this promotion went," but designing the system to judge "where this promotion stands among the many promotions this brand has repeatedly run."
③ Context Data
- Performance metrics by product dimension (category/style) across all past promotions
- Performance metrics by store/channel dimension (format) across all past promotions
- This brand's reference range including averages, distributions, upper and lower bounds
This work is virtually impossible for humans to perform. Even a single promotion has hundreds to thousands of product × store combinations, and when years of promotions accumulate, comparison points grow exponentially.
We delegate this labor of comparison to AI, while humans design the evaluation and make execution decisions.
2. Why Before / During / After Graphs Are Intuitive
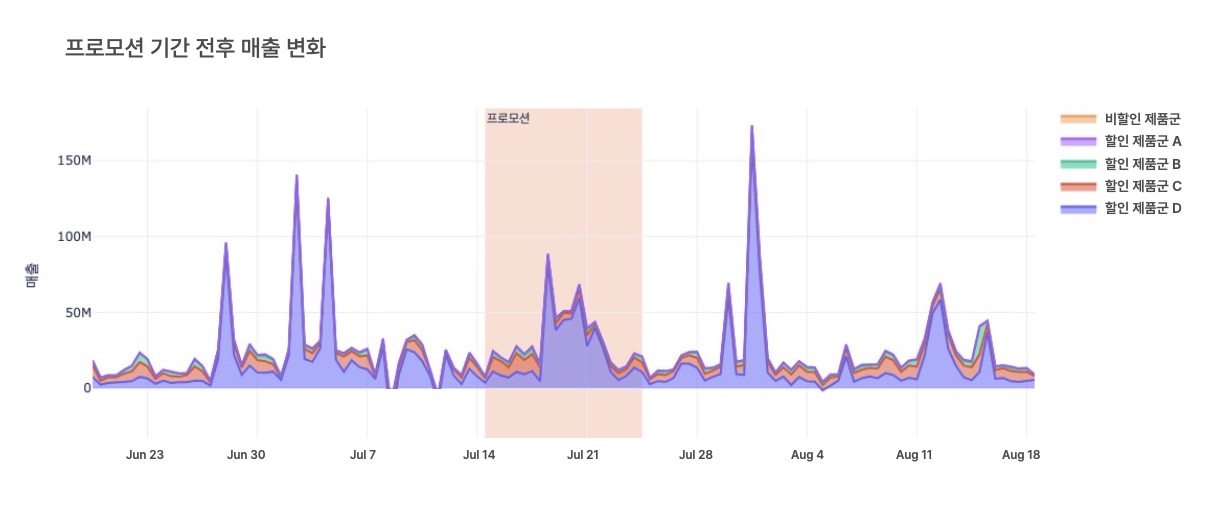
This graph requires no complex explanation. It shades the promotion period and places the before/during/after flow on the same axis. It can be drawn by revenue or sales volume, and you can split between discounted and non-discounted products or view sales changes by product characteristics and store format at a glance.
The following structures become immediately apparent:
- Whether there was a meaningful response versus the baseline trend
- Whether demand pull-forward (payback) occurred after the promotion ended
- When: revenue and depletion concentrated
- How: sales flows differed by product and store
Even in promotions aimed at depletion, drawing this graph frequently reveals cases where the illusion of volume spikes without incremental lift led to overall revenue loss. You can see which product groups and distribution channels actually needed discounts. The "feeling of success" created by broad discount ranges and price cuts is hard to sustain when examined structurally through data.
3. More Important Than 'Revenue Size' Is the Structure of KPI Cards
The most dangerous question in promotion comparison is "How much did we sell?"
We place KPI card sets side by side and examine the structure.
The examples below are entirely fictional, but they represent patterns that repeatedly appear in practice.
[KPI Card Example A – Structurally Healthy Type]
- Promotion Sales: ₩580M
- Incremental Lift: +₩210M
- Cross Lift: +₩50M
- Discount Sensitivity: +0.12
- Promotion Depletion: 6.8%
- Depletion Duration Sensitivity: 48%
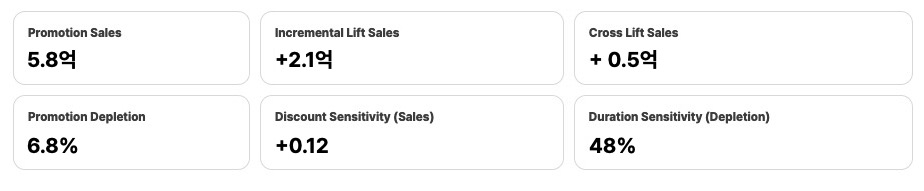
→ Clear incremental revenue occurred in discounted product groups, with cross-selling effects accompanying non-discounted groups.
A 1%p discount increase converts relatively stably into actual revenue increments, and performance concentrates mid-period, making it a low duration design risk type.
[KPI Card Example B – Illusory Type]
- Promotion Sales: ₩640M *(appears larger on the surface)*
- Incremental Lift: +₩140M
- Cross Lift: −₩90M
- Discount Sensitivity: +0.04
- Promotion Depletion: 3.1%
- Depletion Duration Sensitivity: 71%
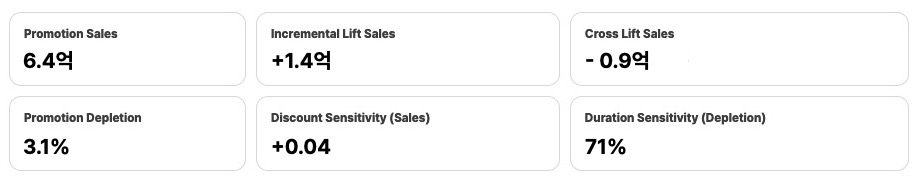
→ While some revenue increments occurred in discounted product groups, clear cannibalization accompanied non-discounted groups. Revenue efficiency relative to discount intensity is low, and performance clusters in the late period, with demand pull-forward patterns observed.
This changes the question.
Not "Why were sales low?" but rather,
"In which structures did pricing work, and in which did cannibalization outweigh the benefit?"
This difference is never revealed by revenue size alone. It only becomes visible when you examine KPI card structures side by side.
4. Conclusions Should Be 'Hypotheses,' Not Evaluations
That's why this AI-automated report's conclusions are never "good/bad" but always organized into actionable hypotheses and rejected (or on-hold) hypotheses.
Because promotions are not one-time events but systems that learn through repeated experimentation.
Below are hypothesis examples directly applicable in operational contexts.
Actionable Hypotheses
- For recurring seasonal promotions (e.g., year-end/holiday sales), rather than running the same 2-3 weeks annually, compressing the period around the top 5-10 day windows where Incremental Lift concentrated in historical data can maintain discount efficiency while reducing price loss. Especially if Duration Sensitivity repeatedly exceeds 60% in the same season, early concentrated operations and quick exits are likely more rational than extending duration.
- In large mall store formats, depletion rates may remain high at the same discount rate while revenue sensitivity is low or negative. In this case, separating roles—outlets for SKU-limited depletion discounts, regular stores for selective incremental revenue discounts—can improve overall structural efficiency.
- If accessories and small product groups show stagnating incremental revenue above a certain discount rate while return/cancellation rates spike, setting a discount ceiling (e.g., 20-25%) with bundle/set configurations may be more favorable from a net revenue and profit perspective.
Rejectable / Hold Hypotheses
- In end-of-season depletion promotions with extended durations justified by inventory depletion, if Discount Sensitivity consistently appears low or negative, extending duration may increase depletion rates but simultaneously amplify price loss and demand payback. The hypothesis that "longer operations favor depletion" should be placed on hold, and periods should be redesigned based on windows where depletion efficiency actually worked.
- If premium/high-end product groups show incremental revenue from short-term popup discounts but return/cancellation rates consistently spike alongside, discount effects should be re-evaluated on a net revenue basis. If the same structure repeats, the hypothesis that "premium products respond to popup discounts" should be placed on hold, and experience/exclusivity-centered approaches may be more appropriate.
- If broad-SKU full-discount promotions show limited Incremental Lift while Cross Lift is consistently negative, the discount range expansion itself is likely creating structural cannibalization. The hypothesis that "broadening scope improves total volume" should be rejected, and transitioning to selective discount strategies centered on core SKUs is more rational.
By redefining data into metrics and leveraging intuitive visuals with AI agent automation, we rapidly analyze dozens of promotions into action plans with clear acceptance and rejection decisions.
As hypotheses accumulate, promotions are no longer events asking "Did this one go well?"
They become learning assets that the organization shares about which structures repeatedly work and which repeatedly create losses.
Promotions are not revenue events but core business activities that determine operating profit.
If you're curious about promotion strategies driven by data and action plans rather than inertia and intuition, reach out to MadMatics.